接口调用指南
- 接口描述
| 接口名称 | 版本 | 接口功能 |
|---|---|---|
| GetMonitorData | 2018-07-24 | 拉取云产品指标监控数据 |
- 输入参数
| 参数名称 | 必选 | 类型 | 描述 |
|---|---|---|---|
| Namespace | 是 | String | 命名空间,如qce/cvm。 示例值:qce/cvm |
| MetricName | 是 | String | 指标名称,如cpu_usage,仅支持单指标拉取。 示例值:cpu_usage |
| Dimensions | 是 | Array | 实例对象的维度组合,格式为key-value键值对形式的集合。不同类型的实例字段完全不同,如CVM为[{"unInstanceId": "ins-miltleuc"}]。单请求最多支持批量拉取10个实例的监控数据。 示例值:[{"unInstanceId": "ins-miltleuc"}, {"unInstanceId": "ins-4xny0cbt"}] |
| Period | 是 | Integer | 监控统计周期,如60,单位为s。每个指标支持的统计周期不一定相同,各个云产品支持的统计周期请参阅本文档附录部分。单请求的数据点数限制为1440个。 示例值:300 |
| StartTime | 是 | Time | 起始时间,如2018-09-22T19:51:23+08:00 示例值:2019-03-24T10:51:23+08:00 |
| EndTime | 是 | Time | 结束时间,如2018-09-22T20:51:23+08:00,默认为当前时间。 EndTime不能小于StartTime 示例值:2019-03-24T20:51:23+08:00 |
- 请求域名
接口请求域名:monitor.api3.${domain_main},如monitor.api3.3100light2az.fsphere.cn。说明:
${domain_main}可以通过登录任意一个pod,打开/tce/conf/cm/local.json搜索domain_main关键字来获取。

4. 请求地域
由于监控数据是按地域上报并且是按地域存储的,因此调用接口时需明确指定被拉取实例所在的地域,地域信息获取方式为:
登录任意一个pod,打开/tce/conf/cm/local.json搜索region_list关键字,里面的region_name即为可用的地域。
5. 调用限频
默认接口请求频率限制:20次/秒
6. 输出参数
| 参数名称 | 类型 | 描述 |
|---|---|---|
| MetricName | String | 指标名 示例值:cpu_usage |
| Period | Integer | 监控统计周期 示例值:60 |
| DataPoints[].Dimensions | Json | 实例对象维度组合 示例值:{"unInstanceId": "ins-miltleuc"} |
| DataPoints[].Points | Array | 数据点数组 |
| StartTime | Time | 开始时间 示例值:2019-03-24T10:50:00+08:00 |
| EndTime | Time | 结束时间 示例值:2019-03-24T20:50:00+08:00 |
| RequestId | String | 唯一请求 ID,由服务端生成,每次请求都会返回(若请求因其他原因未能抵达服务端,则该次请求不会获得 RequestId)。定位问题时需要提供该次请求的 RequestId |
接口调用示例
场景:拉取某台CVM实例某段时间内统计周期为5分钟的CPU利用率监控数据
- 输入示例
POST HTTP/1.1
Host: monitor.api3.3100light2az.fsphere.cn
Content-Type: application/json
Action: GetMonitorData
{
    "Namespace": "qce/cvm",
    "MetricName": "CPUUsage",
    "Period": 300,
    "Dimensions": [
        {
            "unInstanceId": "ins-miltleuc"
        }
    ],
    "StartTime": "2024-03-24T10:51:23+08:00",
    "EndTime": "2024-03-24T20:51:23+08:00"
}
- 输出示例
{
    "Response": {
        "StartTime": "2019-03-24 10:50:00",
        "EndTime": "2019-03-24 20:50:00",
        "Period": 300,
        "MetricName": "cpu_usage",
        "DataPoints": [
            {
                "Dimensions": {
                        "unInstanceId": "ins-miltleuc"},
                "Points": [
                    2.566,
                    2.283,
                    6.316,
                    2.816,
                    2.7,
                    2.35
                ]
            }
        ],
       "RequestId": "d96ec542-6547-4af2-91ac-fee85c1b8b85"
    }
}
SDK代码调用
拉取某台CVM实例某段时间内统计周期为5分钟的CPU利用率监控数据
- golang示例
package main

import (
    "fmt"

    "github.com/tcecloud/tcecloud-sdk-go/tcecloud/common"
    "github.com/tcecloud/tcecloud-sdk-go/tcecloud/common/errors"
    "github.com/tcecloud/tcecloud-sdk-go/tcecloud/common/profile"
    monitor "github.com/tcecloud/tcecloud-sdk-go/tcecloud/monitor/v20170312"
)

func main() {
    secretId := "AKIDxxxxxxxxxxxxxxxxxxxxxxxxxxxxxxxx"        //调用凭证,参考附录
    secretKey := "eyzi69sGK3SWFeiblb8NKwD9l2yZplNf"           //调用凭证,参考附录

    credential := common.NewCredential(secretId, secretKey)
    cpf := profile.NewClientProfile()
    cpf.HttpProfile.Scheme = "HTTP"
    cpf.HttpProfile.ReqTimeout = 10
    cpf.HttpProfile.Endpoint = "monitor.api3.3100light2az.fsphere.cn"      //调用域名,参考本章节的【接口调用指南】中的【3.请求域名】
    client, _ := monitor.NewClient(credential, "city1", cpf)               //云产品实例监控数据所在的地域,参考本章节的【接口调用指南】中的【4.请求地域】

    request := monitor.NewGetMonitorDataRequest()

    request.Namespace = common.StringPtr("qce/cvm")
    request.MetricName = common.StringPtr("cpu_usage")
    request.Period = common.Uint64Ptr(60)
    request.StartTime = common.StringPtr("2024-10-17T15:10:42+08:00")
    request.EndTime = common.StringPtr("2024-10-17T16:10:42+08:00")

    // 构建 Dimensions 字段
    dimensions := []string{
        "{\"unInstanceId\": \"ins-miltleuc\"}",
    }
    request.Dimensions = common.StringPtrs(dimensions)
    response, err := client.GetMonitorData(request)

    if _, ok := err.(*errors.CloudSDKError); ok {
        fmt.Printf("An API error has returned: %s", err)
        return
    }
    // Non-SDK exception, direct failure. Other processing can be added to the actual code.
    if err != nil {
        panic(err)
    }
    // Print the returned json string
    fmt.Printf("%s", response.ToJsonString())
}
- python示例
# -*- coding: utf8 -*-
#
import json
from tcecloud.common import credential
from tcecloud.common.exception.cloud_sdk_exception import CloudSDKException
from tcecloud.monitor.v20170312 import monitor_client, models
from tcecloud.common.profile.client_profile import ClientProfile
from tcecloud.common.profile.http_profile import HttpProfile
import ssl

ssl._create_default_https_context = ssl._create_unverified_context

try:
    secret_id = "AKIDxxxxxxxxxxxxxxxxxxxxxxxxxxxxxxxx"           # 调用凭证,参考附录
    secret_key = "1qVuzkBH3WgWhX3F7LJyJJyIJ0NP77rM"              # 调用凭证,参考附录
    cred = credential.Credential(secret_id, secret_key)

    httpProfile = HttpProfile()
    httpProfile.endpoint = "monitor.api3.3100light2az.fsphere.cn"           # 调用域名,参考本章节的【接口调用指南】中的【3.请求域名】

    clientProfile = ClientProfile()
    clientProfile.httpProfile = httpProfile
    client = monitor_client.MonitorClient(cred, "city1", clientProfile)     # 云产品实例监控数据所在的地域,参考本章节的【接口调用指南】中的【4.请求地域】

    req = models.GetMonitorDataRequest()
    params = {
        "Namespace": "qce/cvm",
        "MetricName": "cpu_usage",
        "Period": 60,
        "StartTime": "2024-10-17T15:10:42+08:00",
        "EndTime": "2024-10-17T16:10:42+08:00",
        "Dimensions": ['''{"unInstanceId": "ins-miltleuc"}''']
    }
    req.from_json_string(json.dumps(params))
    resp = client.GetMonitorData(req)

    # Output json format string back package
    print(resp.to_json_string(indent=2))

except CloudSDKException as err:
    print(err)
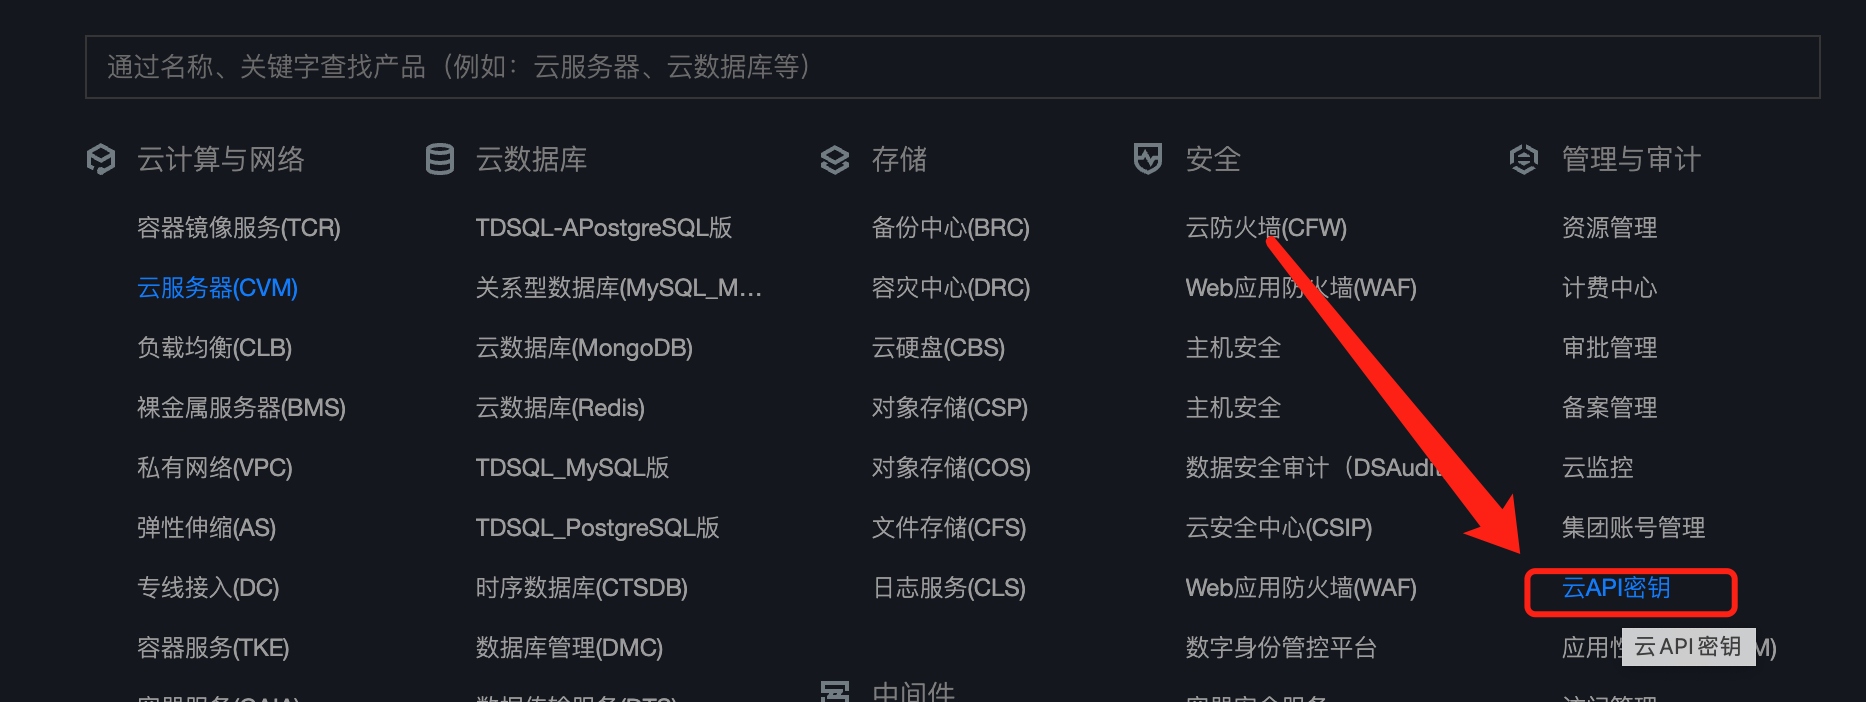
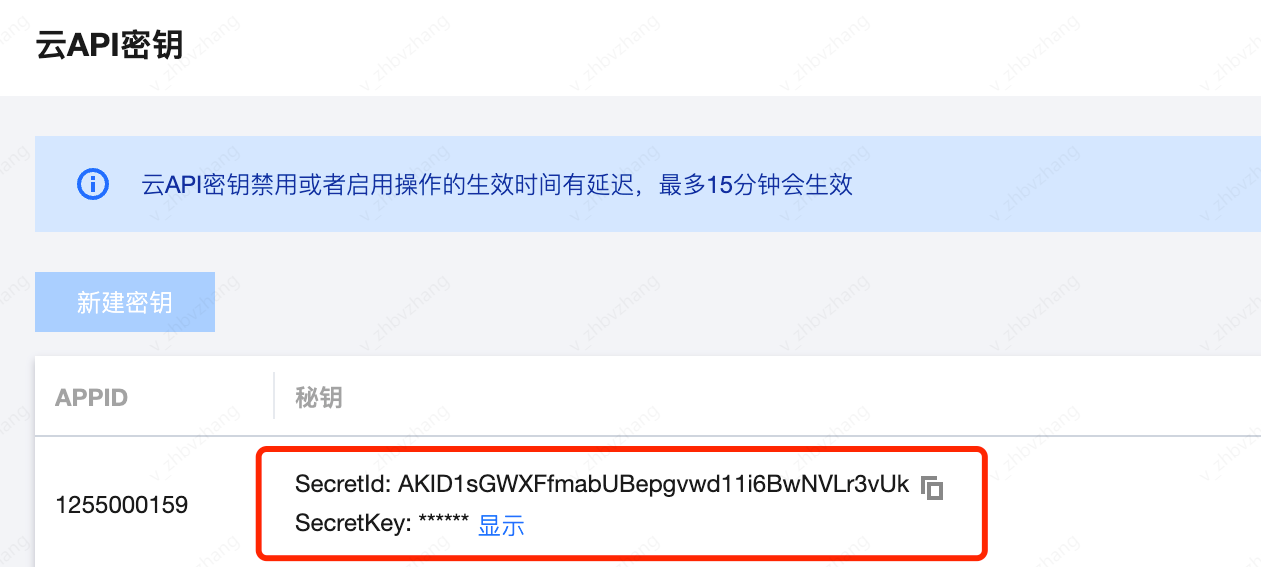
附录:调用凭证创建流程
- 调用凭证:用于调用鉴权,相当于通过secretId和secretKey可以识别调用的appid及uin。
- 创建流程: